Resources
Filter results
Sequential Number ProgramAdditionSubtractionTimes TablesMultiplicationDivisionNumbers and Place ValueRapid Recall Number SkillsQuick 10 - MathematicsRevision/Exam Prep (Maths)Two Step Problem SolvingFractionsDecimalsMoney and Financial MattersPatterns and AlgebraData, Graphs and StatisticsChance and probabilityConverting between units (time, length, mass, volume)TimeLengthAreaMassVolumeAnglesTwo-dimensional shapesThree-dimensional objectsLocation and TransformationMathematics RevisionAssessments Assessments - Upper primaryAssessments - Pre-primaryAssessments - Lower primaryExtendPrintable WorksheetsHundreds ChartTeaching ResourcesTimes Tables (only interactives)Class game - Number GuessTimes Tables (only interactives)
Sequential Number ProgramAdditionSubtractionTimes TablesMultiplicationDivisionNumbers and Place ValueRapid Recall Number SkillsQuick 10 - MathematicsRevision/Exam Prep (Maths)Two Step Problem SolvingFractionsDecimals
Data, Graphs and Statistics
Data, Graphs and Statistics
Grade 6-
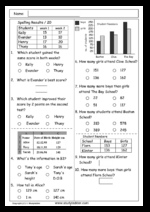
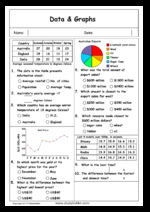
Reading tables.
For students
-
-
- Column graphs
For students
-
-
- Column graphs.
- Practice
-
- Interpreting column graphs - 6
- Practice
-
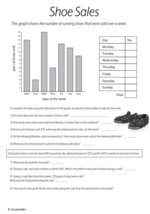
- Column Graph (shoe sales)
- Printable
For teachers
-
-
- Dot plots
For students
-
-
- Line graphs
For students
-
-
- Line graphs
- Practice
-
- Pie graphs
For students
-
-
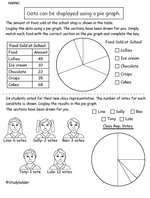
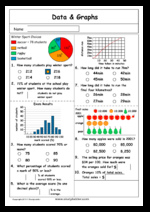
- Interpreting pie graphs
- Practice
-
- Interpret a pie graph
- Practice
For teachers
-
-
- Data (extension)
For students
-
-
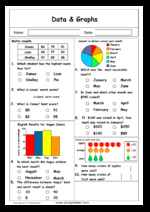
- Data 6a
- Practice
-
- Data 6b
- Practice
-
- Data 6c
- Practice
-
- Data 6D
- Practice
-
- Data 6E
- Practice
For teachers
-
-
Join Now
I would like to register for a:
I would like to:
Upgrade an existing account Pay school administration fee
(You can pay by invoice or credit card)Menu
-
-
- Data (extension)
-
-
- Pie graphs
-
- Line graphs
-
- Dot plots
-
-
- Column graphs
-
-


